
The first time a game of mine ran at 30 FPS when it "should" have been running at 60, I did what almost everyone does: I started optimizing things that sounded slow. I lowered the resolution of some textures, added object pooling to a system that was barely used, rewrote a couple of loops. I gained exactly zero FPS. The bottleneck was somewhere else and I hadn't even looked at it.
Optimizing without measuring is breaking rocks with your eyes closed. This article is about the opposite: using the Unity Profiler to find out, with data, who is eating the frame, before touching a single line.
1. The mistake of optimizing without measuring
A frame at 60 FPS lasts 16.6 milliseconds. At 30 FPS, 33.3 ms. That time budget is split across many things: game logic, physics, rendering, the garbage collector. When the game runs slow, one of those parts is going over budget. The problem is that intuition is terrible at guessing which one.
The code that "looks" expensive often isn't, and the code that usually gets ignored (a GetComponent in an Update, a forgotten Debug.Log, one too many transparent shaders) is the one that sinks it. The only reliable way to know is to measure.
It's not a good idea to start optimizing anything until you have a number in front of you. Every optimization adds complexity, and if it doesn't attack the real bottleneck, that complexity won't give back a single FPS. Measure, fix, measure again.
2. CPU vs GPU: who runs the frame
Before opening the Profiler you need to understand one idea: in each frame, the CPU and the GPU work in parallel, and the frame takes as long as the slower of the two. If the game runs at 40 FPS, the first thing you need to know is whether it's CPU-bound or GPU-bound, because the solutions are opposite.
- CPU-bound: the CPU doesn't finish preparing the frame in time. It's usually heavy game logic, too many scripts in
Update, physics, or (very typically) too many draw calls that the CPU has to send one by one. - GPU-bound: the GPU doesn't finish painting. It's usually overdraw, expensive shaders, high resolution, or too many pixels with transparencies.
If the case is GPU-bound and the approach is to optimize scripts, you gain nothing: the CPU was already idle, waiting on the GPU. That's why this is the first question the Profiler has to answer.
A quick hint without the Profiler: cut the game view resolution in half. If the FPS jump a lot, you're GPU-bound (fewer pixels to paint). If they barely change, you're CPU-bound. This isn't a 100% diagnosis, but it helps identify that first bottleneck.
3. Reading the Profiler
The Profiler opens at Window > Analysis > Profiler (or Ctrl/Cmd + 7). Each row is a module (CPU, Rendering, Memory, etc.) and the horizontal axis is time, one frame per column. The first thing to do is hit play, let something representative happen, then pause and click on a frame that has a spike.
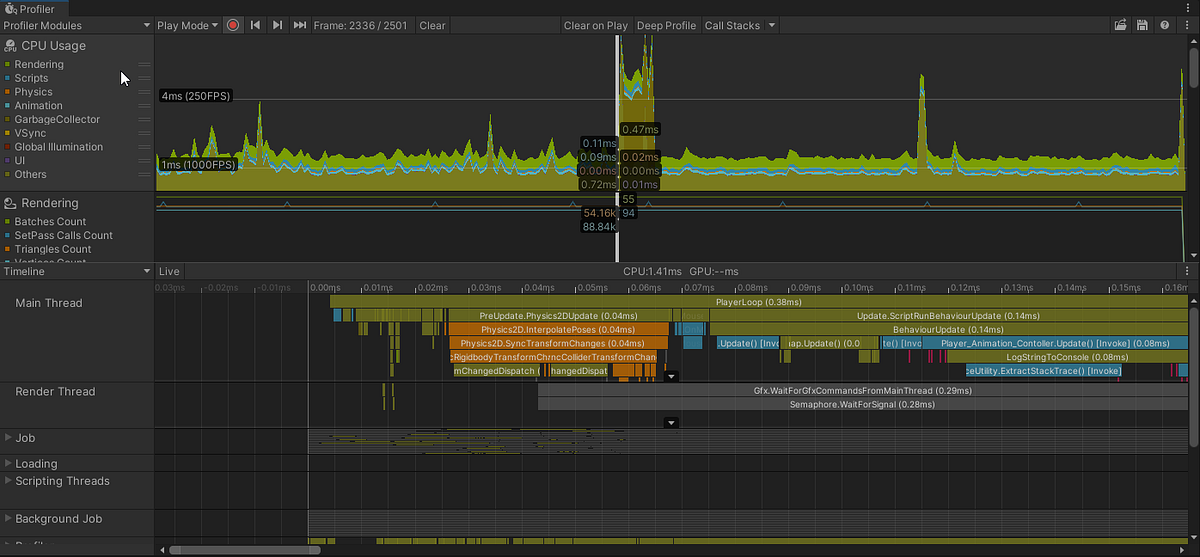
The module that generally gets used most is CPU Usage. With the frame selected, switch the bottom view to Timeline to see which thread is busy, or to Hierarchy to see a table sortable by cost. In Hierarchy you can sort by Time ms or Self ms from highest to lowest: whatever is at the very top is where you should start working.
There are two columns worth always looking at:
Self ms: time spent inside that method, not counting what it calls. If a function has a lot ofSelf, the problem is in it.GC Alloc: memory reserved on the managed heap in that frame. Any number other than zero here is debt you'll pay later.
The Profiler in the editor lies a little: the editor itself adds overhead and some things (like the scene shader) don't represent the final build. For real numbers, you can make a development build with Autoconnect Profiler and profile on the real device, especially when developing for mobile devices.
4. Draw calls and batching
Every time the CPU tells the GPU "paint me this", that's a draw call (draw call). Each call has a fixed preparation cost on the CPU (switching material, uploading state), and that cost multiplies. A thousand objects with different materials can be a thousand calls, and that's where a great many games become CPU-bound without the developer realizing it.
In the Profiler, the Rendering module shows the number of Batches and SetPass Calls per frame. The SetPass Call is the expensive one: it's each render state change that forces the GPU to reconfigure itself. Lowering that number is almost always the biggest CPU performance win.
Some of the tools Unity has to group draws into fewer calls, and that are quite useful, are:
- SRP Batcher (URP/HDRP): groups objects that share the same shader (even with different materials), as long as the shader is compatible. It's the first thing to enable.
- GPU Instancing: for many copies of the same mesh with the same material (trees, rocks, bullets). It's enabled with a checkbox in the material.
- Static Batching: for geometry that doesn't move. Unity combines it into large meshes at build time.
On top of that, a very common pattern for manual instancing of many identical objects could be the following example:
1// Instead of instantiating 1000 GameObjects (1000 potential draw calls),
2// draw the same mesh 1000 times in a single instanced call.
3public class BulletRenderer : MonoBehaviour
4{
5    [SerializeField] Mesh mesh;
6    [SerializeField] Material material; // with "Enable GPU Instancing" turned on
7
8    readonly Matrix4x4[] matrices = new Matrix4x4[1000];
9
10    void Update()
11    {
12        // ... fill matrices with the position of each bullet ...
13
14        // A single call for all 1000 bullets, in blocks of 1023 (API limit).
15        Graphics.DrawMeshInstanced(mesh, 0, material, matrices);
16    }
17}
The SRP Batcher and GPU Instancing don't combine: an object goes through one or the other. And the SRP Batcher breaks if you use MaterialPropertyBlock to vary properties per instance. It's better to look at the Frame Debugger (Window > Analysis > Frame Debugger) to see why two objects weren't grouped: it states the exact reason for each batch.
5. The silent killer: the Garbage Collector
Unity (Mono/IL2CPP) uses a Garbage Collector. When managed memory is reserved (a new, an array, a concatenated string, a closure), that memory piles up until the GC runs to free it. And when the GC runs, it stops the main thread. The result is that occasional hitch you see every few seconds: the frame that normally runs at 2 ms suddenly runs at 20 ms. It's not low FPS, it's a spike, and it's usually worse for the feel of the game than a constant drop.
The way to catch it is the GC Alloc column in the Profiler's Hierarchy view. Generally, methods in Update, FixedUpdate or LateUpdate that reserve memory every frame tend to be the usual culprits:
1void Update()
2{
3    // BAD: concatenating strings reserves a new string every frame
4    scoreText.text = "Score: " + score;
5
6    // BAD: LINQ and lambdas reserve iterators and closures
7    var enemy = enemies.FirstOrDefault(e => e.IsAlive);
8
9    // BAD: GetComponent in a hot path, besides being slow, can allocate
10    var rb = GetComponent<Rigidbody>();
11
12    // BAD: foreach over some collections reserves an enumerator (boxing)
13    foreach (var item in someCollection) { }
14}
The allocation-free version of the same Update:
1Rigidbody rb;              // cached in Awake
2readonly List<Enemy> enemies = new();
3
4void Awake() => rb = GetComponent<Rigidbody>();
5
6void Update()
7{
8    // GOOD: update the text only when it changes, and use a garbage-free format
9    if (score != lastScore)
10    {
11        scoreText.SetText("Score: {0}", score); // TMP API with no allocations
12        lastScore = score;
13    }
14
15    // GOOD: indexed for loop over a List<T>, no enumerator
16    for (int i = 0; i < enemies.Count; i++)
17    {
18        if (enemies[i].IsAlive) { /* ... */ break; }
19    }
20}
For systems that create and destroy objects often (bullets, particles, enemies), it's usually better to use an object pooling pattern: reserve once at the start and reuse, instead of Instantiate/Destroy, which generate garbage. Unity ships UnityEngine.Pool.ObjectPool<T> since 2021, so you don't need to write it by hand.
6. Deep Profile and ProfilerMarker
The Profiler's normal view only shows Unity's methods and the ones that have markers. If the spike is inside your own code and you don't know which function, there are two options.
The fast one is Deep Profile (button at the top of the Profiler): it instruments every method in your code. It gives you the full detail, but adds so much overhead that absolute times stop being reliable. It's useful to see proportions (which function weighs more relative to another), not to measure real milliseconds.
The precise one is to instrument the zones you care about yourself with ProfilerMarker. It has almost zero cost and shows up in the Timeline with the name you give it:
1using Unity.Profiling;
2
3public class PathfindingSystem : MonoBehaviour
4{
5    static readonly ProfilerMarker s_PathfindMarker = new("Pathfinding.Solve");
6
7    void Update()
8    {
9        using (s_PathfindMarker.Auto())
10        {
11            // Everything that happens in here shows up as "Pathfinding.Solve"
12            // in the Profiler Timeline, with its exact time.
13            SolvePaths();
14        }
15    }
16}
With markers in the key systems (AI, pathfinding, world generation) you stop guessing: you see directly in the Timeline which block goes over budget in the spike's frame.
7. From data to FPS
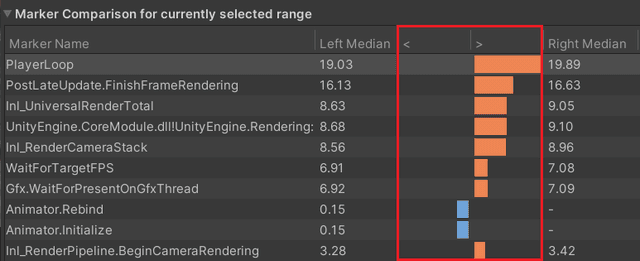
In short, with all these tools and utilities, it's possible to follow a complete flow to detect the bottlenecks and the most critical points of the project:
- Measure the current state. Development build on the target device, not in the editor. Note down the FPS and the frame time.
- CPU or GPU? Cut the resolution in half. If the FPS go up, GPU-bound; if not, CPU-bound. That decides which Profiler module you focus on.
- Isolate the worst frame. Pause on a spike, sort Hierarchy by
Time msand look at the top. CheckGC Allocin case there's garbage per frame. - Fix one concrete case. The one with the biggest impact according to the data, not the one you feel like. Just one, so you can measure its effect.
- Measure again. Did the FPS go up? Good, move on to the next bottleneck. Didn't go up? Revert the change: it wasn't the bottleneck.
The Profiler doesn't tell you what to optimize. It tells you what not to touch, which is usually the 90% of the code you thought was slow. That's its real value: it saves you the useless work.
The difference between fighting with performance for days and fixing it in an afternoon is almost never about knowing more optimization tricks. It's about looking at the right number before you start.


